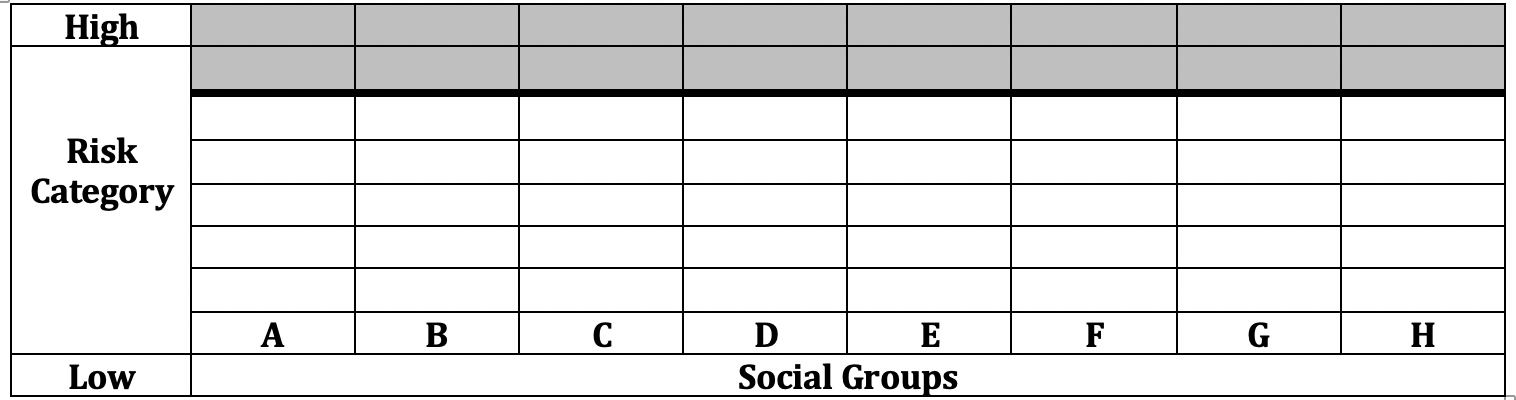
Coronavirus Mortality Reality Check: Figure 2: Same chart as Figure 1 (Risk Category vs Social Groups), but only vtop two rows (the highest-risk categories) are highlighted.

Coronavirus Mortality Reality Check: Figure 2: Same chart as Figure 1 (Risk Category vs Social Groups), but only vtop two rows (the highest-risk categories) are highlighted.